
BPR Cost Break Down
Use the BPR Cost Break Down report to compare quoted pricing against actual system costs for the selected BPR.
Location
Virtual Ops System Location/Navigation: Reports > BPR Cost Break Down
How to Load the Report
- Enter the BPR ID
Enter a BPR ID number in the Enter BPR ID input area in the top left of the window.
- Select an available item
You can also begin typing the ID number and select from the available items.
- Load the report
Click the “Load Report” button after entering your ID number.
- Review the results
The right side of the window and the grid at the bottom of the window will auto-populate.
Report Example
Click the image to enlarge.
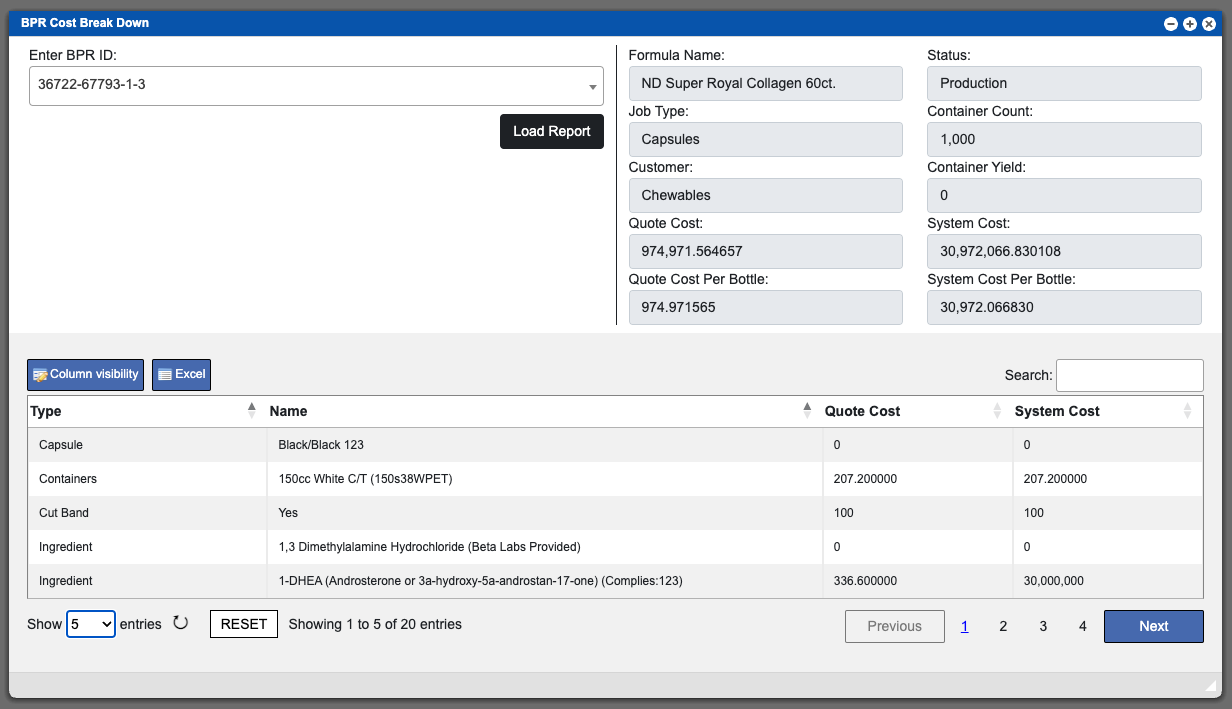
Grid Overview
The grid displays all components and ingredients used in the selected BPR, along with their quoted cost and system, or actual, cost.
Grid entries can be sorted by selecting column titles, using the search function, or applying additional filters. For more information on grid sorting, click here.
Grid Action Buttons
Column Visibility
Change which columns are visible in the current grid. These selections are saved per user, browser, and grid.
Excel
Export the currently displayed grid data to Excel.
How Costs Are Calculated
Formula for Components
QTY Needed for Batch x Current Cost = Batch Cost/System Cost
| Type | Current Cost | QTY Needed | Batch Cost | System Cost |
|---|---|---|---|---|
| Containers | 0.2 | 10,000 | 2,000 | 2,000 |
| Cut Band | 0.5 | 10,000 | 5,000 | 5,000 |
| Desiccant | 0.035 | 10,000 | 350 | 350 |
| Inner Case | 1 | 84 | 84 | 84 |
| Insert | 0.5 | 10,000 | 5,000 | 5,000 |
| Master Case | 1 | 35 | 35 | 35 |